
OTRS 7-Tages Statistik auf dem Dashboard auf 14 Tage erweitern
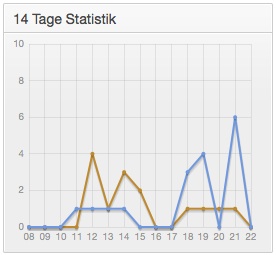
Da gibt es zwar im OTRS Ticketsystem auf dem Agent Dashboard eine kleine Ticketstatistik aber die zeigt nur die letzen 7 Tage an.
Ich hätte aber gerne eine Ansicht, die die letzten 14 Tage auswertet, damit ich den Unterschied zwischen den Wochen sehen kann.
Umsetzbar ist das effektiv recht einfach mit einer kleinen Änderung in der Datei kernel\output\html\DashboardTicketsStatsGeneric.pm
Die Zeilen in rot müssen durch die Zeilen in grün ersetzt werden:
# --
# Kernel/Output/HTML/DashboardTicketStatsGeneric.pm
# Copyright (C) 2001-2010 OTRS AG, http://otrs.org/
# --
# $Id: DashboardTicketStatsGeneric.pm,v 1.18 2010/11/01 15:41:28 mb Exp $
# --
# This software comes with ABSOLUTELY NO WARRANTY. For details, see
# the enclosed file COPYING for license information (AGPL). If you
# did not receive this file, see http://www.gnu.org/licenses/agpl.txt.
# --

package Kernel::Output::HTML::DashboardTicketStatsGeneric;

use strict;
use warnings;

use vars qw($VERSION);
$VERSION = qw($Revision: 1.18 $) [1];

sub new {
 my ( $Type, %Param ) = @_;

 # allocate new hash for object
 my $Self = {%Param};
 bless( $Self, $Type );

 # get needed objects
 for (
 qw(Config Name ConfigObject LogObject DBObject LayoutObject ParamObject TicketObject UserID)
 )
 {
 die "Got no $_!" if !$Self->{$_};
 }

 return $Self;
}

sub Preferences {
 my ( $Self, %Param ) = @_;

 return;
}

sub Config {
 my ( $Self, %Param ) = @_;

 my $Key = $Self->{LayoutObject}->{UserLanguage} . '-' . $Self->{Name};
 return (
 %{ $Self->{Config} },
 CacheKey => 'TicketStats' . '-' . $Self->{UserID} . '-' . $Key,
 );

}

sub Run {
 my ( $Self, %Param ) = @_;

 my %Axis = (
 '7Day' => {
 0 => 'Sun',
 1 => 'Mon',
 2 => 'Tue',
 3 => 'Wed',
 4 => 'Thu',
 5 => 'Fri',
 6 => 'Sat',
 },
 );

 my @TicketsCreated = ();
 my @TicketsClosed = ();
 my @TicketWeekdays = ();
 my @TicketYAxis = ();
 my $Max = 0;

 for my $Key ( 0 .. 6 ) {
 my $today = 14;

 for my $Key ( 0 .. $today ) {


 my $TimeNow = $Self->{TimeObject}->SystemTime();
 if ($Key) {
 $TimeNow = $TimeNow - ( 60 * 60 * 24 * $Key );
 }
 my ( $Sec, $Min, $Hour, $Day, $Month, $Year, $WeekDay )
 = $Self->{TimeObject}->SystemTime2Date(
 SystemTime => $TimeNow,
 );

 unshift(
 @TicketWeekdays,

 [ $today - $Key, $Self->{LayoutObject}->{LanguageObject}->Get( $Axis{'7Day'}->{$WeekDay} ) ] ## org
 [ $today - $Key, $Self->{LayoutObject}->{LanguageObject}->Get( $Axis{'7Day'}->{$WeekDay} ) ] ## 6 -> today
 [ $today - $Key, $Day ] ## Monatstage

 );

 my $CountCreated = $Self->{TicketObject}->TicketSearch(

 # cache search result 30 min
 CacheTTL => 60 * 30,

 # tickets with create time after ... (ticket newer than this date) (optional)
 TicketCreateTimeNewerDate => "$Year-$Month-$Day 00:00:00",

 # tickets with created time before ... (ticket older than this date) (optional)
 TicketCreateTimeOlderDate => "$Year-$Month-$Day 23:59:59",

 CustomerID => $Param{Data}->{UserCustomerID},
 Result => 'COUNT',

 # search with user permissions
 Permission => $Self->{Config}->{Permission} || 'ro',
 UserID => $Self->{UserID},
 );
 if ( $CountCreated > $Max ) {
 $Max = $CountCreated;
 }
 push @TicketsCreated, [ $today - $Key, $CountCreated ]; ## 6 -> today

 my $CountClosed = $Self->{TicketObject}->TicketSearch(

 # cache search result 30 min
 CacheTTL => 60 * 30,

 # tickets with create time after ... (ticket newer than this date) (optional)
 TicketCloseTimeNewerDate => "$Year-$Month-$Day 00:00:00",

 # tickets with created time before ... (ticket older than this date) (optional)
 TicketCloseTimeOlderDate => "$Year-$Month-$Day 23:59:59",

 CustomerID => $Param{Data}->{UserCustomerID},
 Result => 'COUNT',

 # search with user permissions
 Permission => $Self->{Config}->{Permission} || 'ro',
 UserID => $Self->{UserID},
 );
 if ( $CountClosed > $Max ) {
 $Max = $CountClosed;
 }
 push @TicketsClosed, [ $today - $Key, $CountClosed ]; ## 6 -> today
 }

 # calculate the maximum height and the tick steps of y axis
 if ( $Max <= 10 ) {
 for ( my $i = 0; $i <= 10; $i += 2 ) {
 push @TicketYAxis, $i
 }
 }
 elsif ( $Max <= 20 ) {
 for ( my $i = 0; $i <= 20; $i += 4 ) {
 push @TicketYAxis, $i
 }
 }
 elsif ( $Max <= 100 ) {
 for ( my $i = 0; $i <= ( ( ( $Max - $Max % 10 ) / 10 ) + 1 ) * 10; $i += 10 ) {
 push @TicketYAxis, $i
 }
 }
 elsif ( $Max <= 1000 ) {
 for ( my $i = 0; $i <= ( ( ( $Max - $Max % 100 ) / 100 ) + 1 ) * 100; $i += 100 ) {
 push @TicketYAxis, $i
 }
 }
 else {
 for ( my $i = 0; $i <= ( ( ( $Max - $Max % 1000 ) / 1000 ) + 1 ) * 1000; $i += 1000 ) {
 push @TicketYAxis, $i
 }
 }
 my $ClosedText = $Self->{LayoutObject}->{LanguageObject}->Get('Closed');
 my $CreatedText = $Self->{LayoutObject}->{LanguageObject}->Get('Created');

 my @ChartData = (
 {
 data => \@TicketsClosed,
 label => $ClosedText,
 color => "#BF8A2F"
 },
 {
 data => \@TicketsCreated,
 label => $CreatedText,
 color => "#6F98DF"
 }
 );

 my $ChartDataJSON = $Self->{LayoutObject}->JSONEncode(
 Data => \@ChartData,
 );

 my $TicketWeekdaysJSON = $Self->{LayoutObject}->JSONEncode(
 Data => \@TicketWeekdays,
 );

 my $TicketYAxisJSON = $Self->{LayoutObject}->JSONEncode(
 Data => \@TicketYAxis,
 );

 my $Content = $Self->{LayoutObject}->Output(
 TemplateFile => 'AgentDashboardTicketStats',
 Data => {
 %{ $Self->{Config} },
 Key => int rand 99999,
 ChartData => $ChartDataJSON,
 TicketWeekdays => $TicketWeekdaysJSON,
 TicketYAxis => $TicketYAxisJSON
 },
 KeepScriptTags => 1,
 );

 return $Content;
}

1;
Am Ende noch den Fenstertitel anpassen, denn die Überschrift heißt weiterhin "7 Tage Statistik". Das geht recht einfach über die SysConfig in OTRS selbst. Einfach nach "0250-TicketStats" suchen und das Feld ganz unten anpassen.
Ach ja, diese Anleitung ist für OTRS 3.1.1